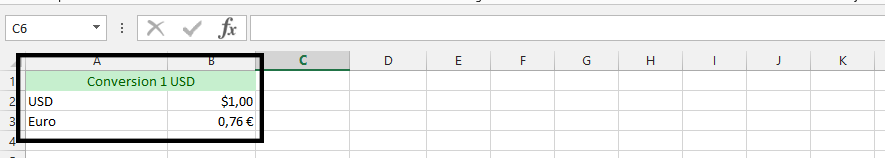
How to Convert Currency in Excel
If you work with different currencies in Excel, you might want to convert them to a common currency for easier comparison or analysis. In this Excel tutorial, you will learn how to convert currency in Excel.
Excel Skills Simplified: Tutorials That Actually Work
If you work with different currencies in Excel, you might want to convert them to a common currency for easier comparison or analysis. In this Excel tutorial, you will learn how to convert currency in Excel.
In this Excel tutorial article, you will learn how to convert an Excel spreadsheet into an online database. What is an online database? It is a database that can be accessed by computers anywhere in the world.
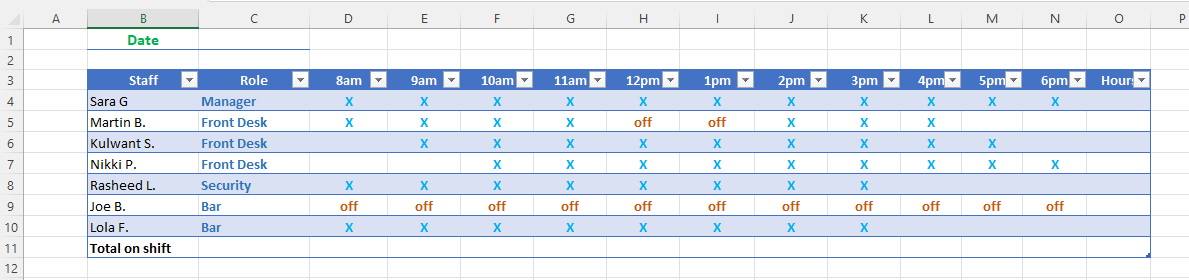
A rota, also known as a schedule or shift schedule, is a plan that dictates when employees are working and what their duties will be. Most businesses use some form of a rota to ensure that their employees are working efficiently and effectively. People traditionally created rotas using pen and paper, but there are many benefits to creating them in Excel.
We will cover the definition of a rota, the advantages of using Excel for rota creation, and its benefits. We will also provide information on how to create a rota in Excel and the industries that can benefit from its use.
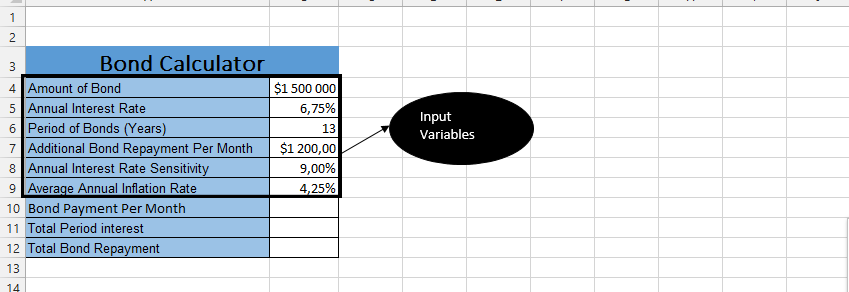
In this Excel tutorial, you will learn how to prepare bond repayment calculator in Excel.
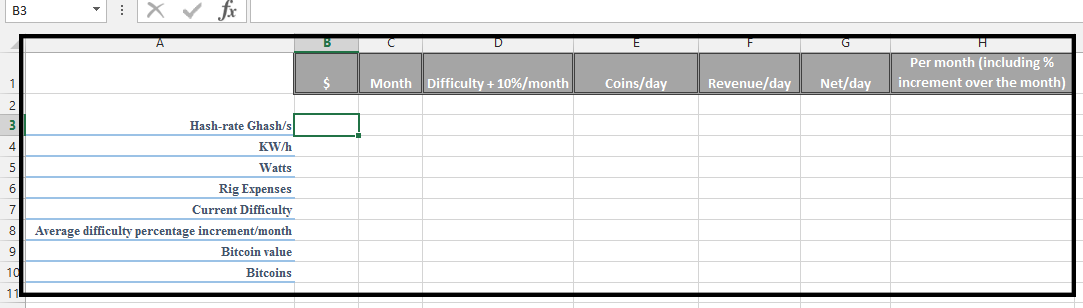
Bitcoin mining can be a profitable venture, but it is important to calculate the profitability of your mining operation before you get started. This can be done by using a Bitcoin mining calculator.
A Bitcoin mining calculator is a tool that can help you estimate the profitability of your mining operation based on a number of factors, including the price of Bitcoin, the cost of electricity, and the hashrate of your mining rig.
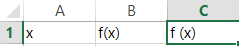
The Newton-Raphson method is a numerical method used to find the roots of an equation, i.e., the values of x that make the equation equal to zero. It is a powerful tool for solving complex non-linear equations, and it can be implemented in Excel using a combination of the “Goal Seek” function and a user-defined function.
The Newton-Raphson method is based on the idea of iteratively improving an estimate of the root, based on the tangent line to the curve of the equation at the current estimate. The method starts with an initial guess for the root, and then calculates a new estimate.
Follow the steps below to learn how to use Newton Raphson Method in Excel.
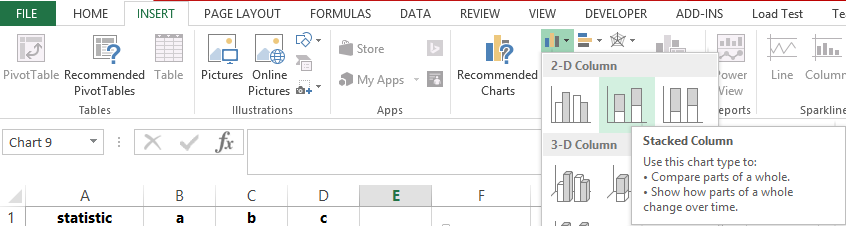
An SPC (Statistical Process Control) control chart is a graphical representation of process data over time, used to detect any potential out-of-control conditions or assignable causes of variation in a process. In this lesson, you will learn how to create a statistical process control chart.
Follow the steps below to create add in in Excel.
Entropy is a measure of disorder in a system. The higher the entropy, the more disordered the system. Entropy change is the difference between the entropy of the initial state and the entropy of the final state.
The entropy change formula is (xij*log2 (xij)). To calculate the entropy change in Excel follow the steps below.
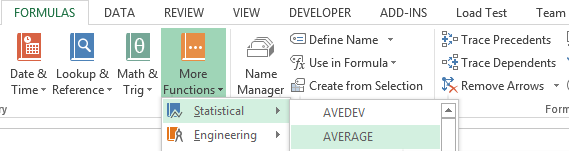
The mode represents the most frequently occurring number in any given data set. When you calculate the mode in Excel, you identify which value appears most often in your data. This statistical measure helps you understand data distribution patterns and make informed decisions. To calculate the mode in Excel, you must use dedicated Excel functions. Below, I’ll show you exactly how to do this using simple, step-by-step instructions.
To learn how to calculate the mode in Excel, follow the step-by-step instructions presented below. We will use sample data throughout this tutorial to demonstrate each function. First, open Excel and create a new spreadsheet. Then, enter your data into the cells.