Chart with Horizontal Bands in Excel
In this Excel tutorial, you will learn how to create a chart with horizontal bands. Adding horizontal bands can be useful for visualizing thresholds, target zones, or performance levels on a chart.
How to Create Horizontal Bands in Excel
To create a chart with horizontal bands in Microsoft Excel, follow these steps:
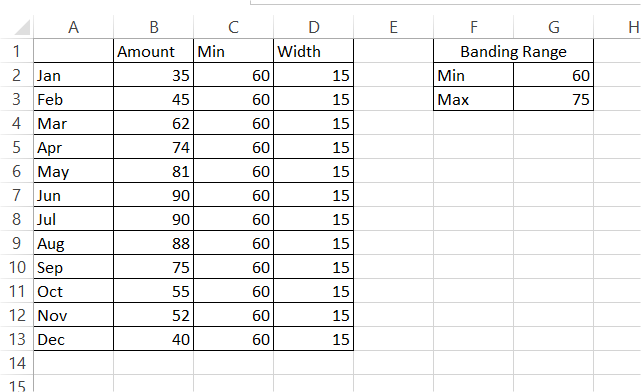
First, prepare some data. You need values and bands. You then need min and max values of the band. Structure your data with columns for your primary chart series and separate columns for the Min and Width of each band.

The width of your band is Width = Max – Min
How to insert a band chart?
Go to the ribbon and the Insert tab. Create a Stacked Column chart.

Right-click one column with your data. Choose the Change Series Chart Type option.

Choose a Line Chart.

Right-click on the Min column and choose Format Data Series.

Next, change the fill to No Fill.

Right-click the Width column as well. Change the Gap Width to 0%.

Your own chart with horizontal bands is ready.

With these steps, you should be able to create a chart with horizontal bands in Microsoft Excel. You can further customize the chart by changing the font, color, and other formatting options, as well as by adding additional data and formatting the axis.


Leave a Reply