How to Adjust the Status Bar in Excel
The status bar in Excel, at the bottom of the window, shows helpful stats from selected cells like average, count, and sum. You can quickly adjust the status bar to show more info or hide what you don’t need. Learning how to customize the Excel status bar saves you time with no formulas required.
What Does the Status Bar Show?
The status bar is a fast way to check totals, averages, or counts. Just select cells, and Excel displays results at the bottom. No need to enter a formula! For example, select a list of sales numbers sum, average, and count appear immediately.

Suppose you want to compare totals or see an average. Select the cells containing your data, and look at the status bar for instant results.

Average, Count and Total are the standard settings of the status bar, but you can change them by right-clicking on the status bar. At this moment you are only interested in the options marked in the figure below a red frame.

Customizing the Status Bar
Let’s add Minimum and Maximum to the information displayed on the status bar. Now five additional information will be given the status bar.

How Blanks and Zeros Work
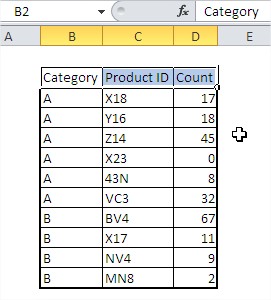
Note that all calculations are made without blank cells. For example, if you delete data for 4 products that failed to sell, the average will be 17 for the remaining 6 products. The minimum sale will be 2.

To avoid such problems for products that failed to sell, enter zero. In the figure below, the correct values are calculated, the average is 12 and the minimum 0.

Customizing the status bar in Excel is a simple yet powerful way to enhance your data analysis capabilities.


Leave a Reply