How to Make a Progress Chart in Excel
A progress chart in Microsoft Excel is a visual representation of progress towards a goal or target. It can be used to track the progress of a project, the completion of tasks, or the attainment of a certain target. In this Excel charting tutorial you will learn how to make a progress chart. Inserting a progress chart has multiple reasons.
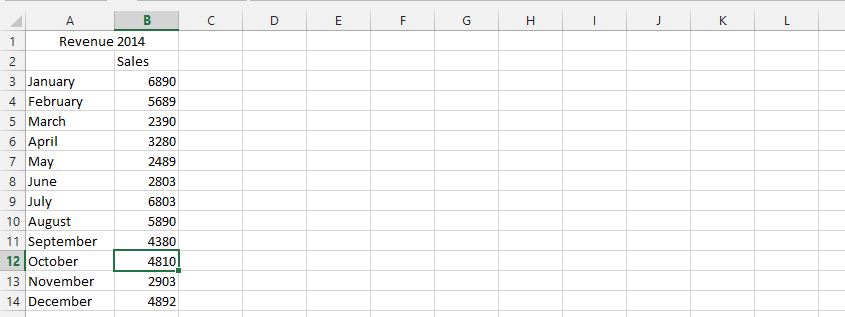
Progress data preparation
Prepare your data with columns for categories, progress values, and indicators.

Note: The green, red and yellow signs you’d see between the values were made by following these steps: home > conditional formatting > icon sets > shapes.
Inserting a progress chart
To insert progress chart in Excel do as follows:
Mark the data (1), click insert (2), then click bar chart (3), and finally click on one of the options (4). Choose a bar chart style from the options provided.

Click add chart element (1), data labels (2), and inside end (3).

Note: The “Add Chart Element” would be visible, the moment the chart was inserted.
In the end, the chart would look like this:

Your progress chart is now ready to track and visualize progress effectively.


Leave a Reply