How to Create a Petal Chart in Excel for Data Visualization
A petal chart, also known as a star chart, is a type of radar chart that plots the values of each category along a separate axis that starts in the center of the chart and ends in the outer ring. Petal charts are a useful way to compare multiple values across multiple categories.
Preparing Data
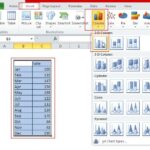
For practice purposes, use the following data to create a star chart with similar results. For this, you can copy this data to your worksheet, or you can use your own data.
To start with, copy the example worksheet data into a blank worksheet, or open the worksheet that contains the data that you want to plot in a petal chart.
Select the data that you want to plot in the star chart, including labels.
Inserting Petal Chart
On the Insert tab, in the Charts group, click Other Charts.
Under Radar, click Filled Radar
If you want to change the color theme of the chart, click on the chart area of the chart. This displays the Chart Tools, adding the Design, Layout, and Format tabs.
On the Design tab, in the Chart Styles group, click the chart style that you want to use.
To change the size of the chart, on the Format tab, in the Size group, select the shape size that you want in the Shape Height and Shape Width boxes, and then press ENTER.
Here are some additional tips for creating a petal chart in Excel:
- Use clear and concise labels for your categories.
- Use different colors for each category to make the chart easier to read.
- You can also add a title to the chart to provide context.
- If you have a lot of data, you can use a legend to help readers identify the different categories.
How to Customize a Petal Chart
You can customize a petal chart by changing the following elements:
- Colors: You can choose different colors for each category to make the chart easier to read.
- Labels: You can change the labels for each category.
- Title: You can add a title to the chart to provide context.
- Legend: You can add a legend to help readers identify the different categories.
- Gridlines: You can show or hide the gridlines.
- Axis labels: You can show or hide the axis labels.
- Chart style: You can choose a different chart style to change the overall look of the chart.
How to Use a Petal Chart to Compare Different Products
Petal charts can be used to compare different products on a variety of factors. For example, you could use a petal chart to compare the features of different laptops, the prices of different cars, or the performance of different stocks.
To use a petal chart to compare different products, you will need to create a table of data that includes the name of each product, the value of each factor, and the category for each factor. For example, if you are comparing the features of different laptops, you might have a table with the following columns:
- Product Name
- Screen Size
- Processor
- RAM
- Storage
Once you have created the table of data, you can create the petal chart by using the following steps:
- In Excel, select the data that you want to use for the chart.
- On the Insert tab, in the Charts group, click Other Charts.
- Under Radar, click Filled Radar.
- The petal chart will be inserted into your worksheet.
- You can customize the petal chart by changing the colors, labels, and other elements.
Here are some additional tips for using a petal chart to compare different products:
* Use clear and concise labels for your categories. * Use different colors for each category to make the chart easier to read. * You can also add a title to the chart to provide context. * If you have a lot of data, you can use a legend to help readers identify the different categories.
By following these tips, you can use petal charts to compare different products in a clear and concise way.
Limitations of Petal Charts
Petal charts are a versatile tool that can be used to visualize data in a variety of ways. However, they also have some limitations.
- Petal charts can be difficult to read if there are too many categories or data points.
- Petal charts can be misleading if the categories are not evenly spaced.
- Petal charts are not as effective as other chart types for comparing values across multiple categories.
If you are considering using a petal chart, it is important to be aware of these limitations. You should also consider using other chart types, such as bar charts or line charts, if they are more appropriate for your data.
Leave a Reply