How to Create a Case-Sensitive VLOOKUP Formula in Excel
In this Excel lesson, you will teach yourself how to create a case-sensitive vlookup. This is a clever way to solve many problems caused by caps lock keyboard button.
Excel Skills Simplified: Tutorials That Actually Work
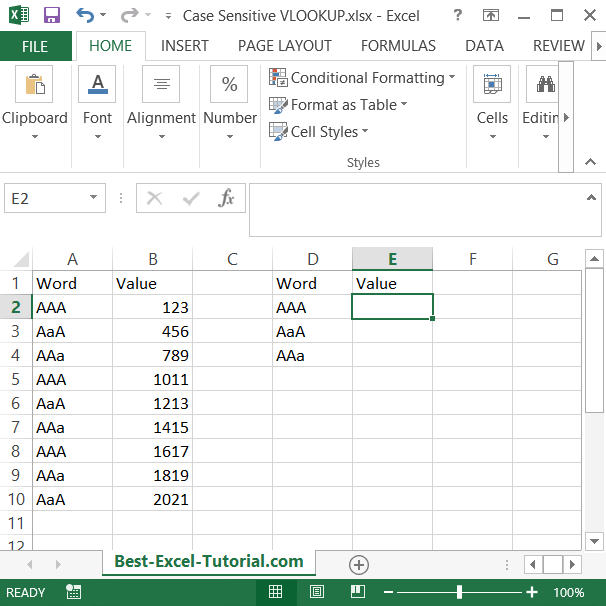
In this Excel lesson, you will teach yourself how to create a case-sensitive vlookup. This is a clever way to solve many problems caused by caps lock keyboard button.
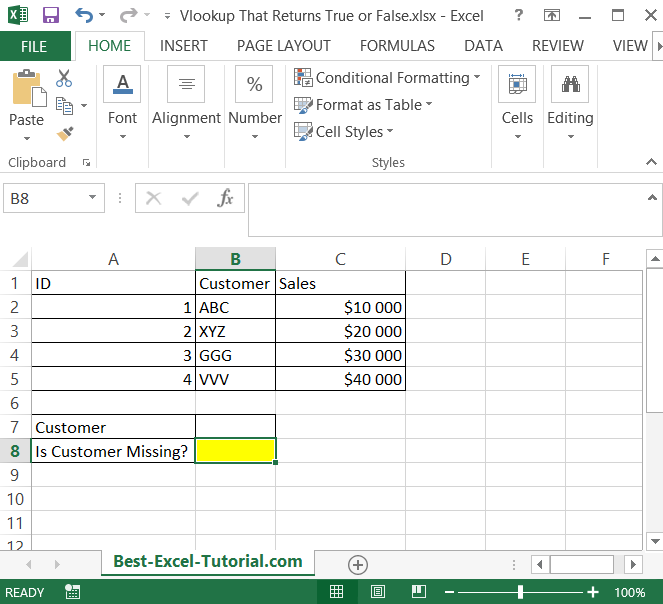
The VLOOKUP function in Excel can be used to return a value from a table based on a lookup value. However, sometimes you might want to return a simple True or False result based on whether or not a value exists in a table.
In this article, you learn how to create a vlookup formula which returns just true of false. You may need it to check if you have some data missing.
Converting image data into an Excel spreadsheet enables you to work with extracted information efficiently. Whether you’re dealing with scanned invoices, tables from photos, or data-rich documents, Excel provides the perfect environment to organize, validate, and analyze your converted data. Here’s how to handle JPG to Excel conversion with a strong focus on Excel’s tools and features.
Mastering the RANK function in Excel is crucial if you want to organise and analyse data by position. It shows how high or low each value stands compared to the rest of the list. This guide explains how RANK works and how to use it effectively in your spreadsheets.
Creating a round-robin schedule in Excel involves organizing a series of matchups where each participant or team plays every other participant an equal number of times. Here are step-by-step instructions to create a simple round-robin schedule using Excel:
Creating QR codes directly in Excel lets you encode data, URLs, and other information into scannable codes. At the same time, you keep everything organised inside your spreadsheet. Excel offers several ways to generate QR codes. You can use simple built‑in functions or more advanced automation. These options make it easy to create codes for inventory tracking, product labelling, customer engagement, or data management. Unlike external tools, Excel keeps your data and QR codes together in one central place.
The Vector Error Correction Model (VECM) is an econometric model used to analyze cointegrated time series data. It extends the Error Correction Model (ECM) to multiple variables, enabling you to capture both short-term dynamics and long-term relationships among several non-stationary time series. VECM is widely utilized in econometrics, especially when dealing with non-stationary data that share a long-term equilibrium relationship.
Implementing a VECM in Excel is challenging due to the advanced statistical computations required, such as conducting Johansen’s cointegration test, estimating cointegration vectors, and constructing error correction terms. Specialized statistical software like R, EViews, or Stata is typically preferred for these tasks because they offer built-in functions that handle complex calculations efficiently.
The KPSS (Kwiatkowski-Phillips-Schmidt-Shin) test is a statistical test used to check for the stationarity of a time series around a deterministic trend. Unlike the Augmented Dickey-Fuller (ADF) test, which tests for unit roots, the KPSS test assumes that the series is stationary around a trend and tests against the null hypothesis of stationarity. Conducting a KPSS test in Excel requires a series of steps, as Excel does not have a built-in function for this specific test. However, you can perform the test by manually calculating the necessary statistics or using Excel’s capabilities for statistical analysis with some setup.
Excel is the industry standard for financial modeling, offering powerful tools to build comprehensive models that simulate business scenarios and forecast financial performance. By leveraging Excel’s formulas, functions, and structural capabilities, you can create dynamic models that enable informed decision-making based on scenario analysis and sensitivity testing.
Excel allows you to scroll left and right in a worksheet using the mouse or keyboard shortcuts.