How to Create Forex Spreadsheet in Excel
A powerful spreadsheet tailored for forex trading can be crafted using various methods. This tutorial article guides you through one effective approach to build such a spreadsheet.
Table of Contents
Forex data download
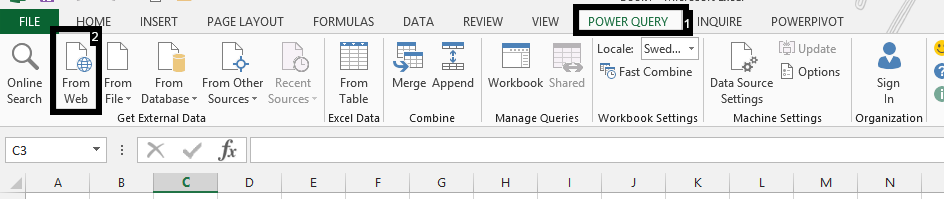
Begin by clicking on Power Query and selecting From Web.

Navigate to the website where you conduct your forex trading. Since this can vary among traders, you’ll need to copy the link from your specific trading platform.

Choose a data table that aligns with your trading requirements.

Finally, click Load.

Creating a forex datasheet
This method proves invaluable to forex traders as it facilitates real-time data integration directly from the source. Your spreadsheet will resemble like in the picture.

Once you’ve input all your data, leverage Excel’s built-in functions and charting tools for a comprehensive analysis of currency pair performance.
Calculate average daily ranges, craft line charts to visualize price trends, or apply conditional formatting to highlight cells based on specific conditions, such as high or low closing rates.
Note: Ensure the accuracy and currency of your data to maintain the reliability of your analyses. Forex data can be sourced from various providers, including brokers, banks, and financial data platforms. Always keep your data up-to-date for informed trading decisions.


Tammy
Pretty section of content. I just stumbled upon your weblog and in accession capital to assert that I acquire in fact enjoyed account your
blog posts.