How to Make a Flow Chart in Excel
Learn how to make a flow chart in Excel to organize and visualize your business processes, workflows, and decision trees in a clear and professional manner. Creating a flowchart in Excel is easier than you might think and provides an excellent way to document and improve your workflow efficiency.
Creating a flow chart
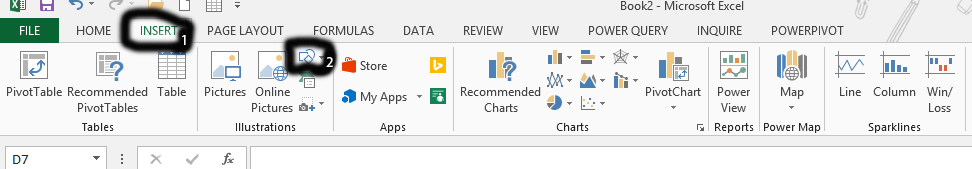
In Excel, you’ll find drawing tools that are perfect for creating flowcharts. Click on the “Insert” tab in the Excel ribbon.
Under the “Insert” tab, locate the “Shapes” option. Click on the shape you want to use for the first step of your flowchart.

Click on the shape you want to use for the first step of your flowchart. You can choose from standard shapes like rectangles, ovals, diamonds, and more.

Click on the shape you’ve just inserted, and a text box will appear inside it. Type in a brief description of the action or decision this shape represents (e.g., “Click on Insert”).

To connect this shape to the next step in your process, go back to the “Shapes” menu under the “Insert” tab. Select a line or arrow to connect the shapes. Place it beside the first shape and connect it to the next shape you want to add.
Repeat steps to create additional shapes and lines for each decision, action, or outcome in your process. Excel allows you to adjust the size and position of shapes easily, making it a convenient tool for building complex flowcharts.

Excel offers extensive formatting options to enhance the visual clarity and professionalism of your flowchart. You can modify shape fills, outlines, text fonts, and connector styles through the Shape Format tab that appears when a shape is selected.
Furthermore, use the Align and Distribute tools (also found on the Shape Format tab) to precisely arrange and space the shapes, creating a neat and organized layout.


Leave a Reply