How to Calculate Cagr in Excel
In this lesson, you will learn how to calculate CAGR in Excel.
What is CAGR?
CAGR (Compound Annual Growth Rate) is the year-over-year average growth rate over a period of time. By calculating CAGR, you can check how much you earn annually with your investments.
There are several ways to calculate CAGR in Excel.
Methods of CAGR calculations
Method 1. Dedicated formula
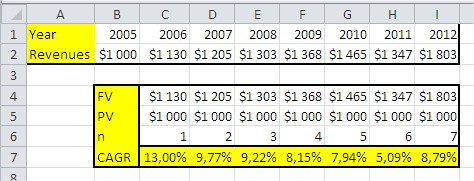
To calculate CAGR, you can use that formula:
= ((FV/PV)^(1/n)) – 1

The picture shows an example of the formula. I think everything is clear.
Method 2. RRI function
The other way is to use the RRI Excel function.
RRI function takes 3 arguments:
- nper (the same as n in the previous example)
- PV
- FV
In such a situation, the function in the given example will be: =RRI(C6,C5,C4)

The results are the same, so it proves that both of the methods are working the same way.
Method 3. Power function
Calculating CAGR is possible with the Power function
The other way to calculate a Compound Annual Growth Rate is possible with a Power Excel function.
The formula would be like this: =POWER(I4/I5,1/COUNT(C6:I6))-1 which is in fact =POWER(FV/PV,1/NPER)-1

Power function usage might be surprising to you, but the explanation is simple. To calculate a CAGR, you just need to calculate the rate of future value divided by present value. At this rate, you should power by the number of periods, which is 7 in our example. Of course, the result needs to be decreased by 1 to get the percentage value.
Method 4. GEOMEAN function
Another example to calculate cagr is to use the cagr function.
The first step is to calculate the growth factor. It is simply the ratio of future value to present value. Growth factor is greater than zero when the future value is greater than the present value, and less than zero when the present value is greater.
Then, using the geomean function, we calculate the geometric mean of the growth factor. The CAGR is the geometric mean minus one.

The full geomean formula is: =GEOMEAN(C6:I6)-1
Method 5. IRR function
The IRR function calculates the internal rate of return, which can be interpreted as the CAGR of the investment.
=IRR(cash_flows)
Method 6. XIRR function
The XIRR function is used for investments with irregular cash flows and considers the timing of each cash flow.
=XIRR(cash_flows, dates)
Method 7. RATE function
The RATE function calculates the interest rate for investments with regular cash flows.
=RATE(nper, pmt, PV, FV)
Practical Application: CAGR in ETF and Stock Fund Evaluation
While CAGR calculation methods are important for learning, the real power of CAGR analysis is in comparing investment performance, evaluating fund managers, and making buy/sell decisions across equities, ETFs, and mutual funds. By calculating and comparing CAGR across different time periods and benchmarks, investors and analysts can identify which funds deliver consistent returns and which underperform their risk profile.
Example 1: Comparing ETF Performance Against Benchmarks
A financial analyst evaluates three equity ETFs over a 5-year period. Using CAGR calculations:
- Technology ETF: $10,000 → $18,500 over 5 years = 13.1% CAGR
- S&P 500 ETF: $10,000 → $16,200 over 5 years = 10.2% CAGR
- Dividend ETF: $10,000 → $14,800 over 5 years = 8.1% CAGR
This investment performance analysis directly shapes portfolio allocation decisions. The analyst uses CAGR to benchmark each fund against sector indices and decide: “Is this fund manager’s 13.1% CAGR worth the higher tech exposure?” CAGR comparison is critical for retirement portfolios, educational savings, and wealth management.
Example 2: Fund Manager Selection in Corporate Pension Plans
A pension fund manager uses CAGR analysis to evaluate five candidate managers for a $100 million allocation. By calculating rolling 3-year, 5-year, and 10-year CAGR for each manager, they create performance dashboards that integrate with business analytics and KPI tracking systems. Decision-making becomes data-driven: “Which manager delivers consistent CAGR above the 7% liability benchmark?”
Example 3: Stock Portfolio Optimization and Rebalancing
Individual investors use CAGR comparison to identify underperforming holdings. By calculating CAGR for each stock position over 1-year, 3-year, and 5-year periods, they can apply statistical analysis and performance modeling to decide rebalancing strategy. Example: “Stock A had 12% CAGR but just 2% last quarter—is this mean reversion or deterioration?” This quantitative approach supports systematic investment strategy versus emotional decision-making.
Key Takeaway: CAGR is the universal metric for comparing investment returns across different time periods, asset classes, and managers. Whether selecting ETFs, evaluating fund managers, or optimizing individual portfolios, CAGR analysis transforms raw performance data into actionable investment insights that drive better allocation and rebalancing decisions.

Leave a Reply