How to Make Boston BCG Matrix in Excel

In this tutorial, you will learn how to create a BCG Matrix in Excel. The BCG Matix is a chart that shows the potential of your company’s products. BCG stands for Boston Consulting Group; this company created this chart for the first time. The other name is the Ansoff Matrix.

The BCG Matrix is a tool that shows the situation in a company compared to its biggest competitors. It is the basis for planning the strategic future of a company. On the BCG Matrix, the axes report market share (horizontal) and market growth (vertical). Assessing the evaluation of these indicators allows you to classify the product while highlighting the 4 roles of the product that goes, sells or produces.

Why Make a BCG Matrix in Excel?

The BCG Matrix is a valuable tool for businesses of all sizes. It can help you to:

  • Assess your product portfolio and identify areas for improvement.
  • Make strategic decisions about which products to invest in and which products to divest.
  • Track the performance of your product portfolio over time.

Example of a BCG Matrix

The following is an example of a BCG Matrix:

Product Market Growth Relative Market Share
Product A High High
Product B High Low
Product C Low High
Product D Low Low

In this example, Product A is a star product. It is growing rapidly and has a high market share. Product B is a question mark product. It is growing rapidly but has a low market share. Product C is a cash cow product. It is not growing rapidly but has a high market share. Product D is a dog product. It is not growing rapidly and has a low market share.

How to Use the BCG Matrix

The BCG Matrix can be used to make strategic decisions about your product portfolio. The four quadrants of the matrix represent different types of products, each with its own strategic implications:

  • Stars: These are high-growth, high-market-share products. They are the most profitable products in a company’s portfolio and should be reinvested in to maintain their growth.
  • Question Marks: These are high-growth, low-market-share products. They have the potential to be stars, but they require investment to reach that point. Companies need to decide whether to invest in these products or to divest them.
  • Cash Cows: These are low-growth, high-market-share products. They generate a lot of cash, but they do not require much investment. Companies can use the cash generated by these products to invest in stars and question marks.
  • Dogs: These are low-growth, low-market-share products. They are not profitable and should be divested.
See also  How to Make Ogive Chart in Excel

The BCG Matrix can also be used to track the performance of your product portfolio over time. By comparing the position of your products on the matrix from year to year, you can see which products are performing well and which products need attention.

Here are some specific ways to use the BCG Matrix to make strategic decisions:

  • Invest in stars: Stars are the most profitable products in a company’s portfolio, so they should be reinvested in to maintain their growth. This can be done by increasing marketing and sales efforts, developing new features or products, or expanding into new markets.
  • Invest in question marks: Question marks have the potential to be stars, but they require investment to reach that point. Companies need to decide whether to invest in these products or to divest them. If a company decides to invest in a question mark, it should do so with the goal of turning it into a star.
  • Milk cash cows: Cash cows generate a lot of cash, so companies can use the cash generated by these products to invest in stars and question marks. This will help to ensure that the company’s product portfolio is constantly growing and evolving.
  • Divested dogs: Dogs are not profitable and should be divested. This will free up resources that can be used to invest in more profitable products.

The BCG Matrix is a valuable tool that can help businesses of all sizes to make better strategic decisions. By understanding the four quadrants of the matrix and how they apply to your product portfolio, you can make informed decisions about where to invest your resources and how to grow your business.

Preparing Data to BCG Matrix

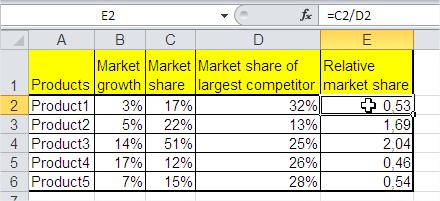
First, you need some data. You need market growthmarket share for all of your products and relative market share.

To get relative market share, just divide the market share of your product by the market share of your largest competitor.

BCG Matrix Data Table

Inserting a BCG Matrix

To insert the BCG Matrix into Excel, select columns A, B and C for all products. Market Growth will be measured using the values of Y axis. Market Share will be the bubble in the chart.

See also  Chart with a single x-axis but two different ranges

BCG Matrix Data

Go to Ribbon > Insert > Other Charts and click Bubble Chart.

Bubble Chart

This is what the basic bubble chart looks like.

Excel Bubble Chart

For further formatting, change the X-axis values. Right-click X-axis values and choose Select Data.

Bubble Chart Select Data

Click Edit to change the source of data.

Bubble Chart Edit Source Data

You have to change the series X values.

Bubble Chart Edit Series

Select Relative Market Share values. It is column E in this example.

Bubble Chart Relative Market Share

Your BCG Matrix chart is a bit changed. Now, all values are correct.

Bubble Chart Not Ready

Let’s continue the formatting of the X Axis. Right-click the X-axis and go to Format Axis. Click Values in reverse Order and change Axis Value to 1 (it depends on your market!).

Bubble Chart Format Axis

Your bubble chart starts to look similar to the BCG Matrix.

BCG Matrix beta

Click the chart. Go to the Ribbon > Layout tab. Click:

  • Gridlines > Primary Horizontal Gridlines > None
  • Legend > None
  • Add both Axis Titles

Right-click the Y-axis and go to Format Axis. Change Axis value to 0,1 (also depends on yor market!)

BCG Matrix Axis Value

The BCG Matrix is almost ready but needs some more formatting.

BCG Matrix almost ready

Do some formatting:

  • Go to Ribbon > Insert > Text Box and insert box in the chart to create some labels
  • Change titles of chart and axes

BCG Matrix is ready.

Example of BCG Matrix in Excel

This is a portfolio of your products:

  • Product3 is your star. You will earn money on this product.
  • Product2 is a cash cow. This is product which is giving you money now.
  • Product4 is a qustion mark. You should invest money in this product.
  • Product1 and Product5 are dogs. Just don’t sell them any more.

Limitations of the BCG Matrix

The BCG Matrix is a simple and easy-to-use tool, but it has some limitations. Here are some of the limitations of the BCG Matrix:

  • It is a static tool. The BCG Matrix does not take into account the dynamics of the marketplace. For example, a product that is a star today could become a dog tomorrow if the market changes.
  • It is a qualitative tool. The BCG Matrix uses subjective measures, such as market growth and relative market share, to classify products. This can make it difficult to make accurate predictions about the future performance of products.
  • It is a single-minded tool. The BCG Matrix only considers two factors: market growth and relative market share. This can lead to companies neglecting other important factors, such as product differentiation and customer satisfaction.

Despite its limitations, the BCG Matrix is a valuable tool that can be used to make strategic decisions about your product portfolio. By understanding the limitations of the matrix, you can use it more effectively.

See also  How to Plot a Line Graph in Excel

Here are some tips for using the BCG Matrix effectively:

  • Use it in conjunction with other tools. The BCG Matrix should not be used as a standalone tool. It should be used in conjunction with other tools, such as SWOT analysis and Porter’s Five Forces analysis, to get a more complete picture of your business.
  • Be aware of the limitations of the matrix. The BCG Matrix is a simple tool and it has some limitations. Be aware of these limitations when using the matrix to make decisions.
  • Use the matrix to make informed decisions. The BCG Matrix can help you to make informed decisions about where to invest your resources and how to grow your business. However, it is important to use the matrix in conjunction with other factors and to make decisions based on your own judgment.

Alternatives to the BCG Matrix

The BCG Matrix is a popular tool, but it is not the only tool that can be used to analyze a company’s product portfolio. Here are some alternatives to the BCG Matrix:

  • Ansoff Matrix: The Ansoff Matrix is a tool that helps companies to identify new growth opportunities. It classifies products into four categories: market penetration, market development, product development, and diversification.
  • Portfolio Analysis: Portfolio analysis is a more general term that refers to any tool that can be used to analyze a company’s product portfolio. There are many different types of portfolio analysis tools, each with its own strengths and weaknesses.
  • Decision Tree Analysis: Decision tree analysis is a tool that can be used to make decisions under uncertainty. It involves creating a tree-like diagram that shows the possible outcomes of a decision and the associated costs and benefits.
  • Monte Carlo Simulation: Monte Carlo simulation is a tool that can be used to generate random numbers and to estimate the probability of different outcomes. It can be used to analyze a company’s product portfolio by simulating the possible outcomes of different decisions.

The best tool for you will depend on your specific needs and situation. If you are new to product portfolio analysis, the BCG Matrix is a good place to start. However, as you become more experienced, you may want to consider using other tools that are more specialized or that can handle more complex situations.

I prepared a template of the BCG Matrix. You can download it here for free.