What is Excel and Basic Knowledge You Need to Know
In this lesson, you get to know some basic definitions in Excel.

Excel is a spreadsheet program that is part of the Microsoft Office suite of software. It is used to perform calculations, data analysis, and create charts. Excel is a powerful tool that can be used for a variety of purposes, including:
- Managing finances
- Tracking inventory
- Creating budgets
- Analyzing data
- Creating presentations
- Charts,
- Dashboards,
- Business intelligence
This article will teach you the basic knowledge you need to use Excel effectively. We will cover the following topics:
- What is Excel?
- What is a spreadsheet?
- Basic Excel terminology
- How to use Excel
- Things to remember
- Next steps
By the end of this article, you will have a good understanding of the basics of Excel and be able to use it to perform simple tasks.
What is Excel?
Excel is a spreadsheet program that is used to store and organize data. It is a powerful tool that can be used for a variety of purposes, including:
- Performing calculations
- Creating charts and graphs
- Analyzing data
- Creating presentations
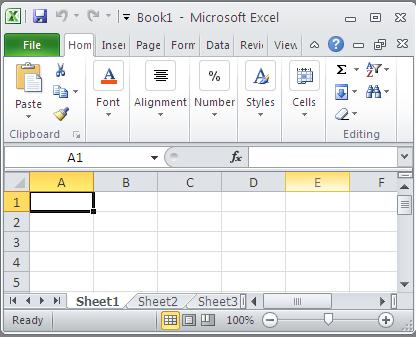
What is a spreadsheet?
A spreadsheet is a grid of cells that can be used to store data. Each cell can contain text, numbers, formulas, or dates. Excel spreadsheets can be used to store large amounts of data and to perform complex calculations.
Basic knowledge of Excel
Here are some basic Excel terminology that you need to know:
- Cell: A cell is the intersection of a row and column in a spreadsheet.
- Workbook: A workbook is a file that contains one or more worksheets.
- Worksheet: A worksheet is a single sheet of spreadsheet data.
- Formula: A formula is an expression that calculates a value based on the data in other cells.
- Function: A function is a pre-written formula that performs a specific task.
- Chart: A chart is a graphical representation of data.
How to use Excel?
Excel is a complex program, but it is relatively easy to learn. The basic steps for using Excel are:
- Create a new spreadsheet.
- Enter data into the cells.
- Format the data.
- Perform calculations.
- Create charts and graphs.
- Save and print your spreadsheet.
Things to remember
- Cells are the basic building blocks of an Excel spreadsheet.
- Formulas are used to perform calculations in Excel.
- Functions are pre-written formulas that perform specific tasks.
- Charts are used to visualize data.
Practical Applications in Business: Next Steps
Now that you understand the fundamental concepts of this Excel feature, the next logical step is to apply them to real-world business scenarios and advanced analysis. Our comprehensive learning hubs show how professionals use these foundations to build dashboards, analyze data, and make strategic decisions.
📊 Explore Business Applications:
- Excel for Business Intelligence & KPI Dashboards – Learn how companies use these fundamentals to build real-time performance dashboards, track metrics, and drive data-driven decisions. Perfect for managers, analysts, and business users building professional dashboards.
- Excel for Personal Finance & Investing – Apply Excel skills to financial planning, investment analysis, and portfolio tracking. Essential for anyone managing personal wealth or analyzing financial data.
- Excel for Data Analysis & Statistics – Combine these concepts with statistical methods for advanced analysis, forecasting, and data interpretation. Required for data analysts and researchers.
These hubs bridge the gap between Excel basics and professional applications. Start with the hub that matches your role or goals—each provides step-by-step guidance and real-world examples.


Leave a Reply