What is Excel and Basic Knowledge You Need to Know
In this lesson, you get to know some basic definitions in Excel.
Excel Skills Simplified: Tutorials That Actually Work
In this lesson, you get to know some basic definitions in Excel.
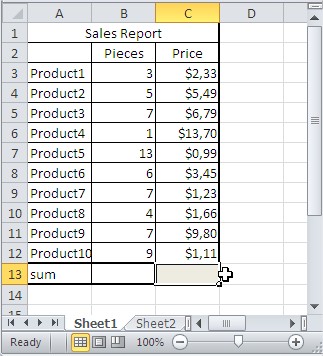
In this Excel tutorial, you can learn how to use SUMPRODUCT function in Excel.
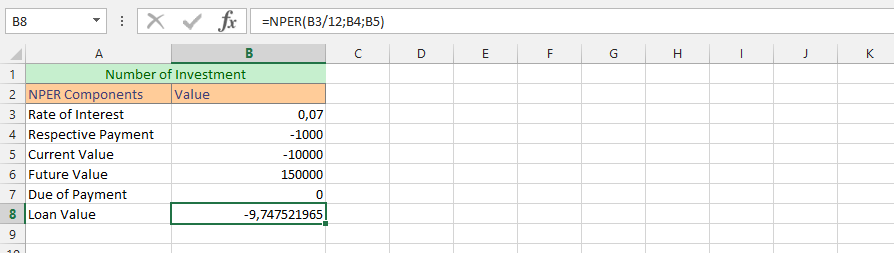
In this lesson, you can learn how to use NPER function in Excel.
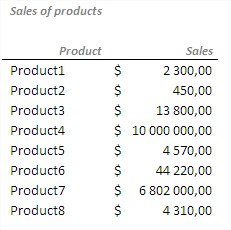
In this Excel tutorial lesson, you will learn what a logarithmic scale is and how to use it with charts.
In this lesson, you will learn how to remove non-printable characters in Excel with the clean and substitute functions.
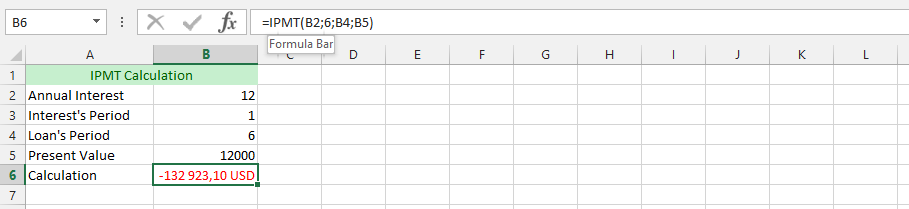
In this lesson, you’ll learn how to use the IPMT function in Excel to calculate interest payments.
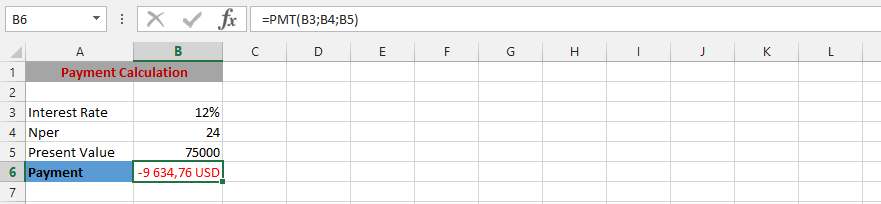
In this lesson, you can learn how to calculate loan installment using PMT function in Excel.
VLOOKUP supports wildcards for powerful partial-matching. Specifically, you can use the asterisk (*) for “any number of characters”, the question mark (?) for “exactly one character”, and the tilde (~) for wildcards literally. Consequently, this enables flexible lookups when exact keys don’t exist or vary in format.
In this Excel tutorial, you’ll learn how to change the background color in Excel to customize your worksheet’s appearance.
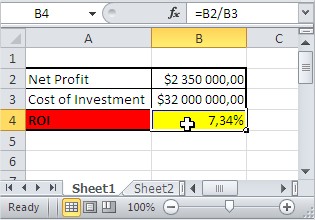
In this lesson, you will learn how to calculate ROI in Excel.