How to make 4 Axis Graph
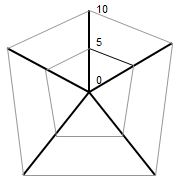
Radar charts, also known as spider charts, web charts or star charts, are used to evaluate multiple alternatives based on multiple criteria. You need to use a radar chart when you have to display multivariate data in the form of a chart that has three or more axis.
For example, you can use a radar chart to analyze the strengths and weaknesses of a number of supply chain strategies or to compare multiple projects graphically. Given below is a simple radar chart with 5 axes on a scale of 0 to 10.