How to Break Y Axis in Excel
In this Excel charting tutorial, you will learn how to break Y axis in chart. It is useful in the case of problems with the axis scale. When your data is really differential, just use this trick.
Excel Skills Simplified: Tutorials That Actually Work
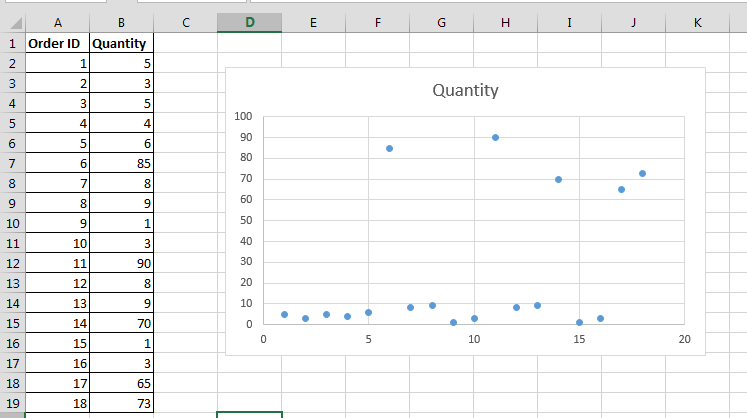
In this Excel charting tutorial, you will learn how to break Y axis in chart. It is useful in the case of problems with the axis scale. When your data is really differential, just use this trick.
What to do when you have ngative values? Read this tutorial to learn how to insert a chart with negative values in Excel.
Thanks to Excel, you can easily calculate. Here you have a free retirement calculator to find out how much you will get as a senior.
Every project manager has to take care of the cost of a project. Use this to calculate it within Excel.
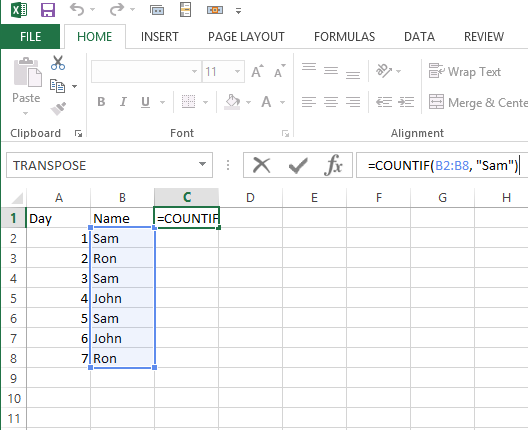
The IF function in Excel allows you to make a logical comparison between a value and what you expect, and returns a result based on whether the comparison is true or false. You can nest multiple IF functions to perform more complex comparisons and make decisions based on multiple conditions.
Let’s together create formula with nested if with combined AND & OR functions. You will need that to select data from your table. This Excel’s lesson is for analytics who would like to select some particular data from the huge data set.
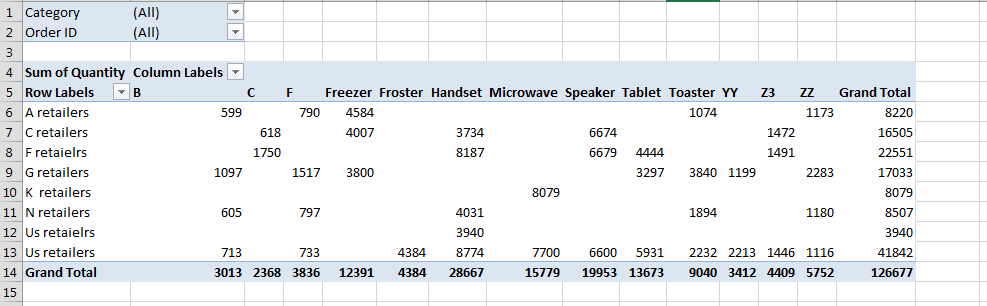
Pivot tables are a powerful tool in Excel that can be used to summarize and analyze data. One of the features of pivot tables is the ability to filter the data. This can be useful for finding the top 10 values in a particular field.
We will show you how to filter the top 10 values in a pivot table in Excel.
There is one important thing in charts. Good labeling. That’s why it is useful to be able to insert professional labels that share the chart into subcategories.
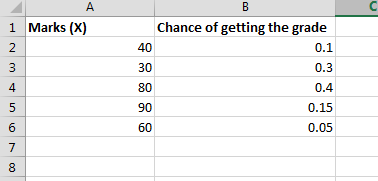
You probably want to know how to calculate probability with Excel. You’ll learn how to calculate probability in Excel using built-in functions like PROB, as well as how to handle more complex scenarios such as dice rolls, coin flips, and poker hands.