How to Calculate Variance in Excel
Variance analysis is a critical aspect of data analysis, and Excel offers robust tools to simplify the process. We will walk you through each step of calculating variance in Excel, ensuring clarity and focus on specific topics. Whether you are working with sample data, population data, or datasets that include non-numeric values, this guide is tailored to provide you with precise insights.
Understanding Variance
What is Variance in Data Analysis?
Variance serves as a measure of the dispersion of values within a dataset. It is derived by averaging the squared deviations from the mean.
The Significance of Variance
The magnitude of variance directly reflects how spread out the values are within your dataset.
To appreciate the importance of variance:
- Higher Variance: Indicates greater variability among values.
- Constant Values: Result in a variance of zero since there are no deviations from the mean.
The Variance Calculation Process
Breaking Down the Variance Calculation Formula
To calculate variance, we follow a clear and focused process:
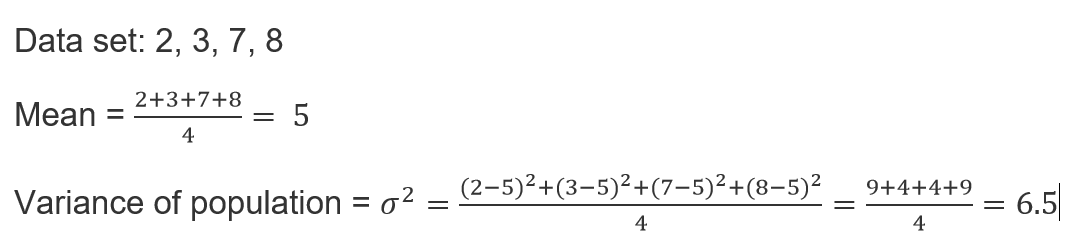
1. Calculate the mean (average) of the dataset.
2. Determine the squared deviations of each value from the mean.
3. Average these squared deviations to obtain the variance.
Here’s the formula for variance:
variance = ∑(x – μ)^2 / n
Where:
- x represents a value in the dataset.
- μ is the mean of the dataset.
- n denotes the number of values in the dataset.
Sample Variance vs. Population Variance
Choosing the Right Approach
Selecting between population and sample variance depends on your dataset:
- Population Variance: Use this when you have data for all observations, representing the entire population.
- Sample Variance: Opt for this when you have data for a subset of observations, a sample.
Degrees of Freedom in Variance
Understanding degrees of freedom:
- Population variance uses all available data.
- Sample variance uses a smaller sample size, and the formula adjusts the denominator:
- Sample Variance: n-1 (degrees of freedom)
- Population Variance: n (sample size n)
This ensures precise variance calculations for your data type.
Excel Functions for Variance
Excel offers three primary functions for calculating variance:
- VAR: A versatile function for calculating variance.
- VAR.S: Specifically designed for sample variance.
- VAR.P: Ideal for population variance.
Syntax of Variance Functions
Understanding the syntax is key to efficient utilization. Below, we break down the essential variance functions:
- VAR(number1, [number2], …): Returns the variance of the values in the argument list.
- VAR.S(number1, [number2], …): Returns the sample variance of the values in the argument list.
- VAR.P(number1, [number2], …): Returns the population variance of the values in the argument list.
- VARA(number1, [number2], …): Returns the approximate variance of the values in the argument list.
- VARPA(number1, [number2], …): Returns the approximate population variance of the values in the argument list.
Examples of the VAR function in Excel
Utilizing the VAR function is straightforward. You can input numbers directly or use cell references or ranges. Here are some examples:
- Direct Input: Calculate the variance of numbers like 2, 3, 4, 5, 6, 7, 8, and 125 using this formula: =VAR(2,3,4,5,6,7,8,125).
- Cell References: Compute the variance of numbers in cells A2, A3, A4, and A5: =VAR(A2,A3,A4,A5).
- Ranges: Find the variance of numbers in cells A2 to A10 and B4 to C10: =VAR(A2:A10,B4:C10).
- Combination: You can even mix these methods within a single formula.

Handling Non-Numeric Values
Excel’s VARA function allows you to calculate variance even with non-numeric values. It assigns values to logical and text data as follows:
- TRUE is counted as 1.
- FALSE equals 0.
- TEXT is treated as 0.
For instance, the formula for VARA function is =VARA(A1:A10).

You now possess a clear understanding of variance, the functions available, and how to select the right one for your data type. Excel’s flexibility empowers you to analyze data with precision, whether it’s numeric or includes non-numeric values.


How to calculate variance in Numpy? : Pythoneo
[…] also: how to calculate a Variance in Excel how to calculate a Variance in […]