How to Add a Scroll Bar to an Excel Chart with Dynamic Ranges
In this Excel charting tutorial lesson, you will learn how to insert a chart with a scrollbar in Excel application. This kind of chart could be useful for more complicated data sets.
Table of Contents
How to create a scroll bar chart?
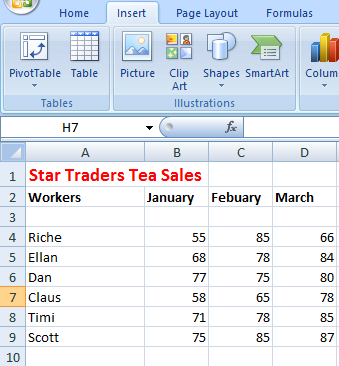
Consider the data and determine where your data set is going to be.

Now, look at where you want your dynamic range. This cell is ultimately going to drive the data that’s reflected within your chart.

Now, press the Ctrl+F3 keyboard shortcut. A window like the one shown below appears. Click New.

A New Name window appears.In the Name Manager dialog, enter a name for your first dynamic range by typing the desired range name (such as Amount for data values).

Again, Name Manager window appears. Choose New.

Fill in the Name field with the Date.

Here you insert the chart. For this, select a 3D column chart. To add the chart, first select your data table. Next, go to ribbon. Click Insert > Column > 3D Column. The following chart is created.

How to add a scroll bar to the chart?
Enable your Developer tab in the ribbon. To do this, go to File > Options > Customize Ribbon. Check the box for Developer. Now, under the Developer ribbon’s tab, choose Insert > Scroll Bar.

Then insert the scroll bar anywhere in the chart window. Then right-click the scroll bar and select Format Control.

On the Control tab, enter the Cell Link.

Then left-click on the chart and under the Chart Tools select Design then Select Data. Select Amount and Edit; the Edit Series is displayed last.

Choose Edit under the Horizontal Axis Labels.

Select the Date series from your sheet.

Here you have successfully created an interactive Excel chart with a scroll bar that allows navigation through large datasets.

Scrollbar is above the chart. You can click on it to change the range of data presented.


Leave a Reply