How to Create a Floating Chart
This is quite an interesting kind of chart in this Excel tutorial. Here you learn how to create floating bars and put them into your chart.
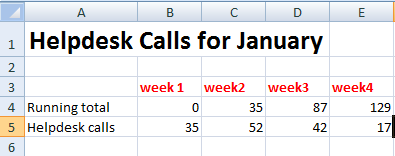
Gather your data. The data for a floating bars chart should be in a table with two or more columns.

How to create floating bars graph?
Select the data range and then click the Insert tab. In the Charts group, click the Column button and then select the 2d Stacked Column chart type.

To make it floating bars chart, right-click on the lower shaded part. Select Format Data Series option.

How do the graph bars float?
Remove the fill from the lower bars. In the Fill section, select the No Fill option.

Add data labels. To add data labels to the chart, click the Layout tab and then click the Data Labels button. Select the Center option.

Your floating bars chart is now ready to use.
You can further customize it by changing the chart type, formatting the chart elements, and adding titles or legends as needed.

Floating bars charts can also be used to compare data sets.
For example, you could use a floating bars chart to compare the sales of two different products over a period of months, or the number of website visitors from two different countries over a period of days.


Leave a Reply