How to Create a Timeline Chart in Excel
In this Excel tutorial, you will learn how to craft a timeline chart – a powerful tool for representing events or milestones along a timescale. Here’s a step-by-step guide on how to create a timeline chart in Excel:
Table of Contents
Data Preparation
Begin by preparing your data. Create a table that includes the dates or milestones you want to represent on the timeline chart, along with any relevant information, such as event descriptions.

Inserting the timeline chart
Navigate to the Insert tab, click on 2D chart, and choose 2-D bar.

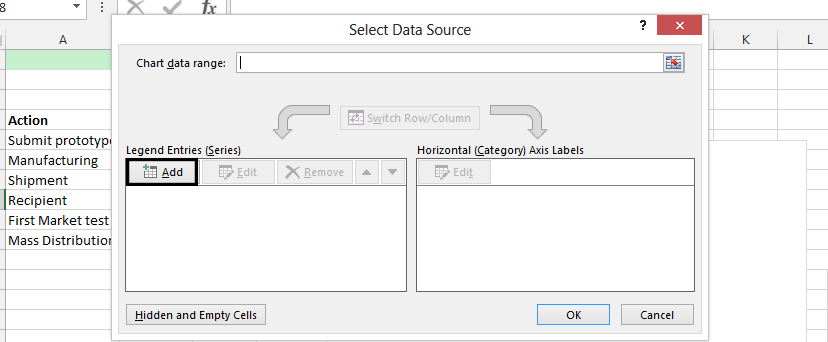
Click on Design, and then on Select Data.

Press Add.

Name the series, and click on the red arrow beside values.

Select all the cells under that series name.

Repeat the same process on the Duration.

Right click on the x-axis, and choose Select Data.

Click Edit.

Choose all the Task/Action labels.

Press Ok.

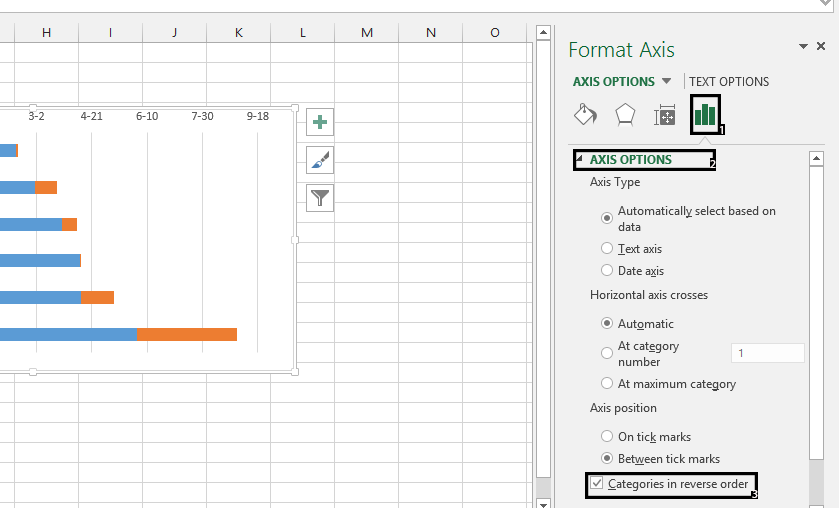
Right-click on the x-axis, and choose Format axis.
Click on the Axis Options and Categories in reverse order.

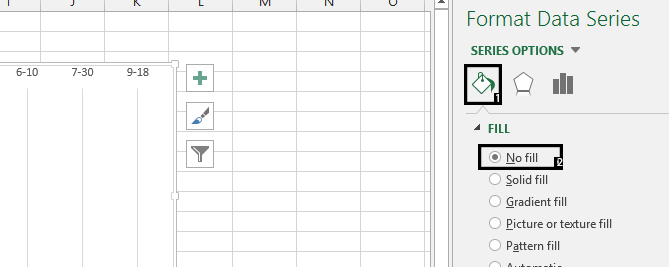
Right-click on the Starts series in the chart, and click on Format Data Series.

Choose No Fill to enhance the timeline’s clarity.

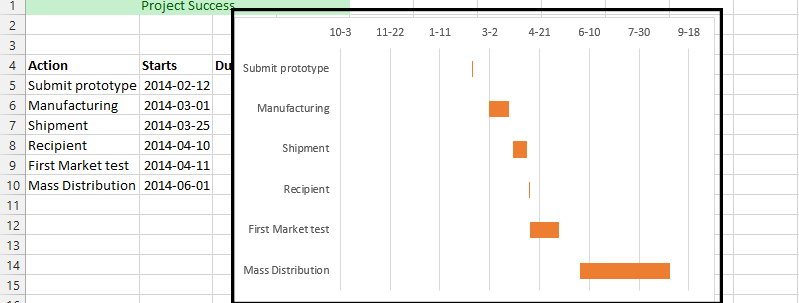
The Timeline Chart is now ready and looking like this:


Leave a Reply