How to Insert Subtotals in Excel
Learn how to insert and use subtotals in Excel to automatically summarize grouped data and streamline your reporting process.
Table of Contents
What are subtotals?
Subtotals are summary statistics that are calculated for each group of data. For example, you can insert subtotals by product category in a sales report to see total revenue per group. The subtotals would show the total sales for each product category.
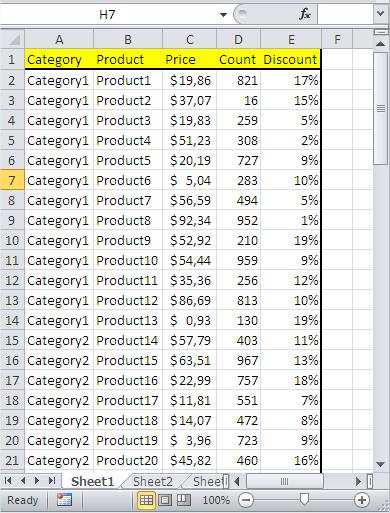
Example report
Subtotals allow you to generate automatic group-level summaries within Excel tables or structured data ranges. You can do many various calculations based on subtotals. See at the table below. That’s an example report.

How to insert Subtotals?
Before using the Subtotal feature in Excel, sort your data by the grouping column to ensure accurate results. If necessary, sort the data by one or more columns to group the data that you want to subtotal.

Go to the Excel Ribbon > Data tab > click the Subtotal button to begin inserting subtotals.

Dialog box appears.

You can choose here:
- For what you want to subtotal
- Which function (eg. Sum, Max, Min, Average, …)
- What you want to subtotal as a result
Excel creates an outline that you can expand with the buttons or plus and minus buttons on the left side of the page.

Level 1
Grand count for data across the table

Level 2
Count of rows for each category

Level 3
Displays the entire table with subtotals below each category

To remove all subtotals and return to the original dataset view, click Remove All in the Subtotal dialog.

If you need to revert to the original table appearance, Excel offers the “Remove All” option to eliminate the outlined subtotals and restore the original presentation.


Leave a Reply