How to Calculate Savings in Excel
Use the Excel application to calculate how much money you will save. Here’s an example of how to set up a savings calculator in Excel.
Preparation of a savings calculator spreadsheet
Use this free calculator to do that.
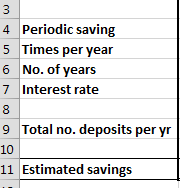
1. Open Excel and make four rows, which are periodic savings, times per year, number of years, interest rate, total number of deposits, and estimated savings.

2. Enter your data in the cells corresponding to the headings: periodic savings, times per year, number of years and interest rate.

3. Calculate the total number of deposits. It is simply calculated by multiplying times per year and no. of years.

Inserting savings formula
4. Now calculate estimated savings using the FV function in Excel in the cell corresponding to estimated savings. The formula goes as follows:
=FV(interest rate/times per year, total number of deposits, periodic savings)*-1

The full formula of the Saving Calculator is:
=FV(B7/B5,B9,B4)*-1
Practical Applications in Home and Business Budgeting
Although a savings calculator seems like a personal tool, it has direct applications in financial planning for both individual investors and small and medium-sized businesses. Understanding how to save and invest money systematically is the foundation for a diversified financial portfolio and stable business cash flow.
Example 1: Capital Change Planning for a Small Business
Imagine a small marketing agency earns $5,000 monthly profit and wants to build a capital reserve for equipment purchases (new computers, software licenses, marketing tools). Using the savings calculator:
- Periodic Savings: $2,000/month (40% of profit)
- Interest Rate: 2% annual (in high-yield savings account)
- Time Period: 2 years
- Result: $49,500 accumulated capital for business investments
This personal finance analysis directly impacts business operations. The company can now confidently budget for tools and equipment without disrupting cash flow. Using this calculator with different scenarios helps determine: “Can we afford this expansion?” or “How long until we have sufficient reserves?”
Example 2: Managing the Operating Fund in E-Commerce
An e-commerce business with seasonal revenue fluctuations uses the savings calculator to plan operational reserves. By analyzing monthly data:
- Off-season savings: $1,000/month (months 1-8)
- Peak season contribution: $3,000/month (months 9-12)
- Interest earnings: Tracked on reserves in business accounts
- Purpose: Maintain cash flow during low-revenue months
This operational planning is critical for business analytics and KPI tracking. E-commerce managers integrate this savings model into their financial dashboards to answer: “Are we building adequate reserves?” and “How does operational cash compare to planned targets?”
Example 3: Investment Portfolio – Medium-Term Accumulation Strategy
Retail investors often use savings calculators to model wealth-building strategies. Consider an investor contributing to a diversified portfolio:
- Monthly contribution: $500 (balanced portfolio)
- Expected return: 7% annually (conservative estimate)
- Time horizon: 10 years
- Projected value: $82,000+ (including compound interest)
This connects directly to statistical analysis and predictive modeling. Investors apply variance analysis to understand: “What if returns are 5% instead of 7?” or “How much should I contribute to achieving my goal?” The savings calculator becomes the foundation for financial forecasting and risk assessment.
Key Takeaway: The savings calculator isn’t just for personal budgeting—it’s a core tool for business financial planning, investment strategy, and operational cash management. Whether you’re managing business reserves, building investment portfolios, or planning capital expenditures, this Excel model provides the quantitative foundation for strategic financial decisions.
Extending the Savings Calculator
To add the ability to track multiple savings goals, you could create a new sheet for each goal and then use the FV function to calculate the estimated savings for each goal. You could then use a pivot table to summarize your savings data across all of the goals.
To add the ability to calculate the interest earned on your savings, you could use the FV function with the rate argument set to the annual interest rate. For example, the following formula would calculate the interest earned on a savings goal with a periodic savings of $100, an interest rate of 5%, and a term of 5 years:
=FV(5% / 12, 5 * 12, 100)
To visualize your savings progress using charts or graphs, you could use the line chart or bar chart to plot the estimated savings over time. You could also use the pie chart to show the distribution of your savings across different goals.
Here you can download this saving calculator.
Note: You can extend this example by adding additional rows for each category of expenses, or by adding a formula to calculate your savings over multiple months or years. You can also use charts or pivot tables to visualize your savings data and gain insights into your spending habits.

Leave a Reply