
Best Excel Tutorial
Excel Skills Simplified: Tutorials That Actually Work
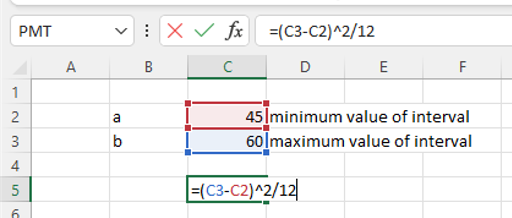
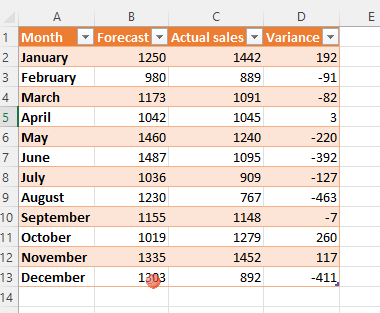
How To Calculate Variance Of Uniform Distribution In Excel: Complete Guide
When all possible outcomes of an experiment are equally likely to occur, this is a uniform distribution.
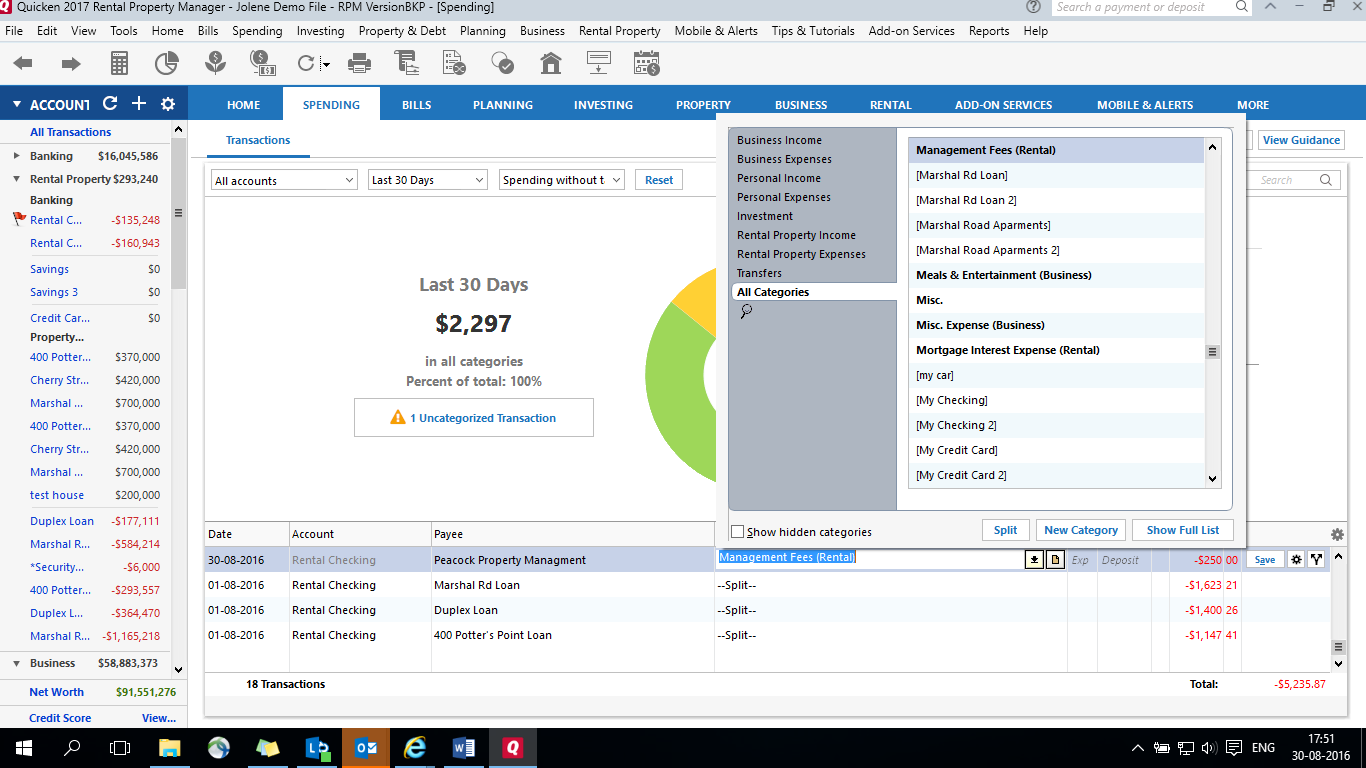
How to Open QIF File in Excel: 2 Methods for Converting Quicken Files
QIF file is a text file that is generated by Quicken financial software. It is used for storing financial data in a text format that can be easily opened by other programs.
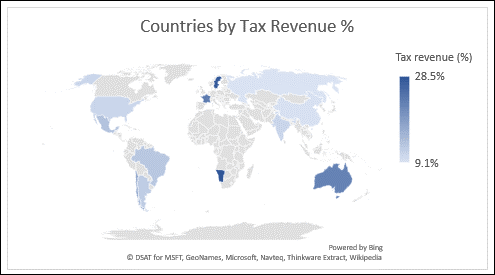
How to Insert a Filled Map Chart in Excel: Complete Tutorial Guide
Excel 2016 came with a lot of new features, one of those was a large number of charts that were implemented after several years of no new ones.
How to Open MPP File in Excel
.MPP file is a file extension that is used by Microsoft Project, project management software that is used for taking care of project plans. Microsoft Project is primarily used by project managers and their teams, providing tools and resources for effective project planning and execution.
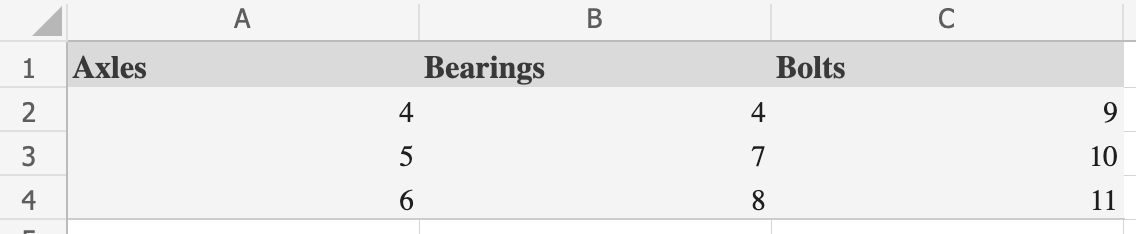
How To Use SQL Statements In Excel
SQL statements can be used to retrieve information from records that may be held in an Excel spreadsheet or a database.

How to Calculate False Position in Excel
If you want to learn how to calculate false position in Excel using the false position method for numerical root-finding, you are in the right place. We will explain what false position is, how it works, and demonstrate how to use the false position root-finding technique in Excel with a practical example.
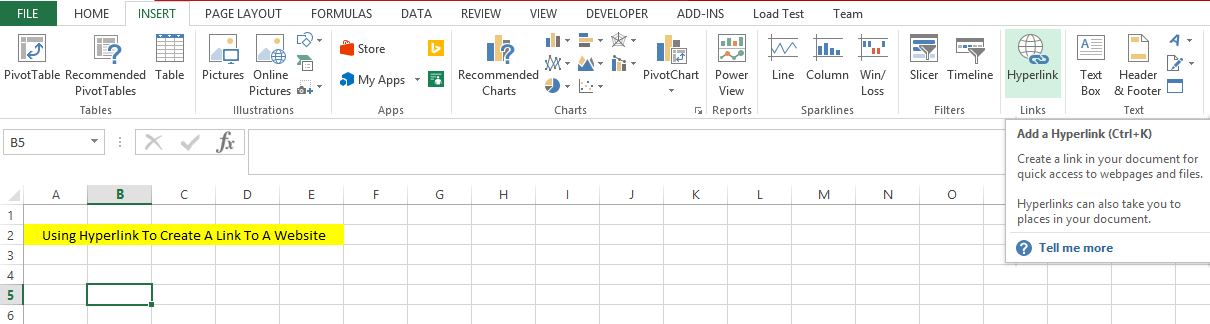
Mastering Excel Links: From Hyperlinks to Linked Documents
Welcome to the ultimate guide on everything related to linking in Excel. Whether you’re curious about hyperlinks, linking documents, objects, or even checking for links between workbooks, this guide has you covered. We’ll walk through the basics and then move on to more advanced linking techniques. By the end, you’ll be a master of Excel links!
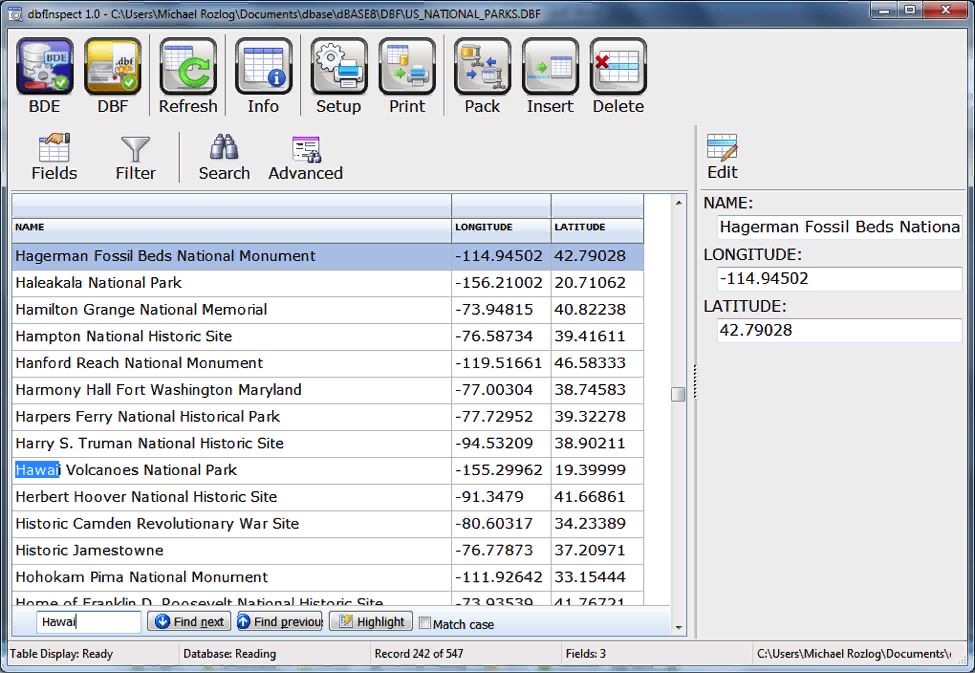
How to open a dbf file in Excel
DBF file is a Database file extension that is used by the data management system dBase. The data that is in the file is stored within a series of various records and fields. It was made for small businesses, that’s why it’s so simple and straightforward. DBF files were used in one of the first data management programs and software.