How to Geocode a Map Using 3D Maps (Previously Power Maps)
Geocoding creates coordinates for a physical location on a map. In this Excel tutorial, you will learn what a geocode is and how to use geocode with 3D Maps.
We can use geocoding along with address details to map data within Excel. Once Excel recognises the address details and applies a geocode, Excel maps this allowing users to see a geographic representation of the data.
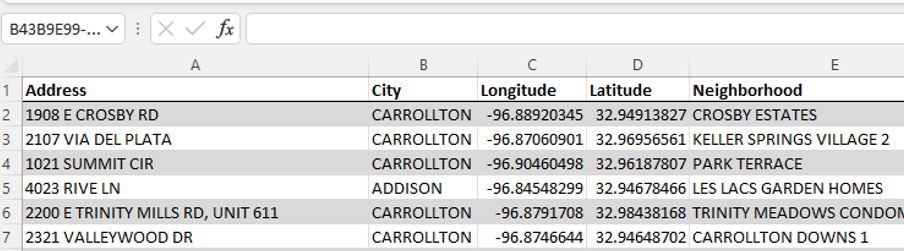
To create a 3D map, you need geographic details in a spreadsheet – full address details, street, city, state, town, zip/post codes – Excel can also use longitude and latitude to create a 3D map. When you click on 3D Maps option the first time, Excel automatically enables the feature.
We will use sample data from a utility provider, they are using geocoding to map the locations of their customers.
Table of Contents
Steps To Create A 3D Map
The steps below will take you through the process using sample data. A quick reference guide is available at the end of this document.
In Excel, open a workbook that has the table or Data Model data you want to explore in 3D Maps. Open How To Geocode A Map Using 3D Maps.

Click any cell in the table.
Click Insert, 3D Map.
Excel opens a 3D Maps window with a map of your geocoded data.

Zoom in to get closer to the data. As you get closer you can see the data points.
Hover over a data point to see details for that record.

Click the settings icon to change the data Excel displays in the tool tip.
The Customize Data Card window opens.

Click Add field to select a field to add to the display.

Click on the field, your choice is now at the top of the card, you also have the options to edit the field name, apply the count function or remove the field from the tool tip.

Press OK to save your changes.
The selected field now appears in the tool tip. The Address field is now visible.

Access the Layer Pane through the ribbon, to check that Excel mapped the fields from the worksheet to the correct fields within the map. E.g., that Excel has mapped city to city. An arrow appears by the mapped fields for you to choose the correct field if needed.

Once you have generated 3D Maps in a spreadsheet a message appears advising that a 3D map is available for this data.

Excel saves your map details after you close the window, clicking the 3D map lists the saved map.

Use this knowlodge to Excel Business Intelligence related tasks.
Quick Reference Guide
- In Excel, open a workbook that has the table or Data Model data you want to explore in 3D Maps.
- Click any cell in the table.
- Click Insert, 3D Map.
- Excel opens a 3D Maps window with a map of your geocoded data.
- Zoom in to get closer to the data. As you get closer you can see the data points.
- Hover over a data point to see details for that record.
- Click the settings icon to change the data Excel displays in the tool tip.
- The Customize Data Card window opens.
- Click Add field to select a field to add to the display.
- Click on the field, your choice is now at the top of the card, you also have the options to edit the field name, apply the count function or remove the field from the tool tip.
- Press OK to save your changes.
- The selected field now appears in the tool tip.
- Access the Layer Pane through the ribbon, to check that Excel mapped the fields from the worksheet to the correct fields within the map. E.g., that Excel has mapped city to city. An arrow appears by the mapped fields for you to choose the correct field if needed.
- Once you have generated 3D Maps in a spreadsheet a message appears advising that a 3D map is available for this data.
- Excel saves your map details after you close the window, clicking the 3D map lists the saved map.


Leave a Reply