Counting unique values in pivot table
In this lesson, you will teach yourself how to do counting only distinct values in pivot table. Do you think it is difficult? You will be suprised.
Table of Contents
How to add unique values in pivot table?
In Microsoft Excel, you can count the number of unique values in a pivot table using the following steps:
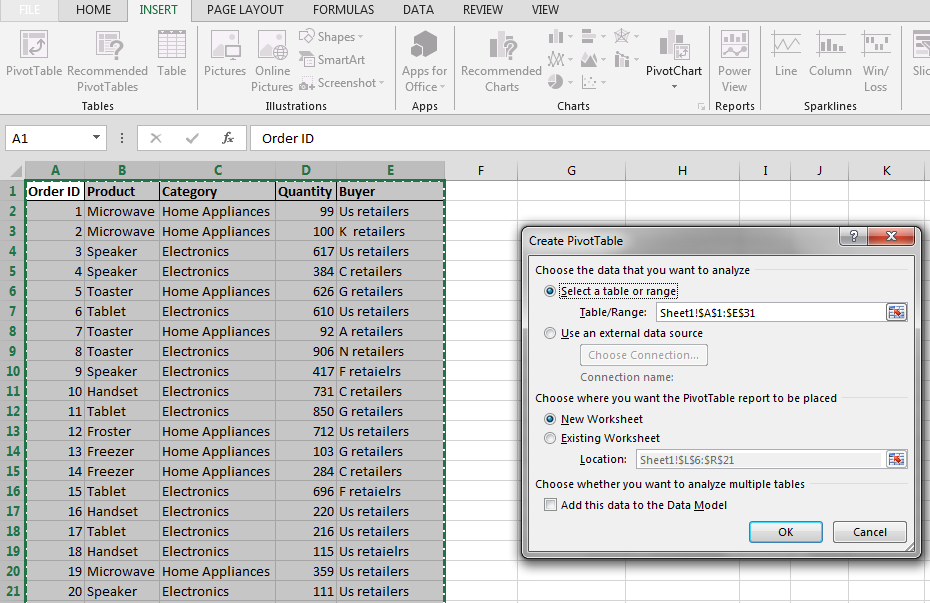
Once the data is entered into an Excel sheet, select the data then go to Insert > Pivot Table.

Select Existing sheet and enter the Location where you want to create the pivot table. Then check the add this value to the Data Model option.

How to count unique values in pivot table?
In the Pivot table Fields pane, drag the fields to lower boxes which are filter, column, rows, and sum of values as per your requirement. Then click the drop down list from Values, select Value Field Settings.

In this dialogue, select the tab Summarize Values By and scroll down. Then select Distinct Count. You will see a pivot table which will count only distinct values.


Leave a Reply