When all possible outcomes of an experiment are equally likely to occur, this is a uniform distribution.
Table of content:
Steps To Calculate The Variance Of A Uniform Distribution
Definition
The formula for uniform distribution calculates the probability of a desired event occurring within an existing interval.
We can calculate the variance of uniform distribution to demonstrate the spread or degree of dispersion of the values of the probability distribution.
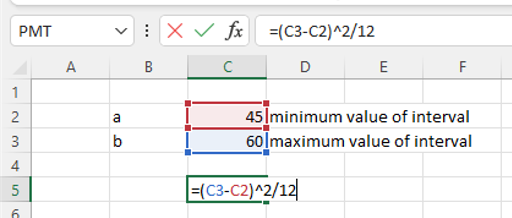
The variance of the distribution is σ2 = (b – a)^2 / 12. In this formula b is the maximum value of the interval, a is the minimum.
For example, some plane spotters are tracking flights at a busy airport, they know flights takes off every 45 – 60 minutes, but they also want to calculate the spread of the take-offs. In this example the maximum value of the interval is 60, the minimum is 45.
Steps To Calculate The Variance Of A Uniform Distribution
The steps below will take you through the process using sample data, using the above scenario.
1. Open the spreadsheet How To Calculate The Variance Of Uniform Distribution In Excel.
2. The equation to calculate the variance of uniform distribution is =(b – a)^2 / 12
- b = maximum values of the interval
- a = maximum values of the interval
3. Identify the maximum values of the interval - 60 minutes in our example.
4. Identify the minimum values of the interval - 45 minutes in our example.
5. In C5 enter =(C3-C2)^2/12, press Enter.
6. Excel displays the variance.
Quick Reference
- Open a spreadsheet
- Identify the maximum values of the interval - b
- Identify the minimum values of the interval - a
- The equation to calculate the variance of uniform distribution is =(b – a)^2 / 12
- In an empty cell formula using the maximum and minimum values you identified in steps 2 and 3.
It's important to note that the uniform distribution is a continuous probability distribution with a constant probability density over a defined interval. The variance of a uniform distribution represents the spread of the distribution, with a larger variance indicating a more spread-out distribution.
Using VAR function
Alternative way to calculate the variance of a uniform distribution in Excel is to use the VAR function. The VAR function calculates the variance of a set of numbers and returns the result as a decimal number.
Here's a step-by-step guide to calculate the variance of a uniform distribution using the VAR function in Excel:
Input the data: Input the data for the uniform distribution into a column of cells in Excel. For example, you can input the data into cells A2 through A11.
Use the VAR function: In a separate cell, use the VAR function to calculate the variance of the data. The formula for the VAR function would look like this:
=VAR(A2:A11)
Where A2:A11 represents the range of cells containing the data for the uniform distribution.
- Calculate the variance: Once you have entered the VAR function, press the "Enter" key to display the result of the variance calculation. The result will be the variance of the uniform distribution, expressed as a decimal number.
Using the VAR function is another way to calculate the variance of a uniform distribution in Excel. This method provides a quick and easy way to calculate the variance without having to manually calculate the formula for variance. However, it's important to make sure that the data inputted into the VAR function accurately represents the uniform distribution you are trying to evaluate.
Using Data Analysis Toolpak
Another method to calculate the variance of a uniform distribution in Excel is to use the Data Analysis ToolPak. The Data Analysis ToolPak is a powerful Excel add-in that provides a variety of statistical analysis tools, including the ability to calculate the variance of a set of numbers.
Here's a step-by-step guide to calculate the variance of a uniform distribution using the Data Analysis ToolPak in Excel:
Enable the Data Analysis ToolPak: To enable the Data Analysis ToolPak in Excel, go to the "Data" tab in the ribbon, click on "Data Analysis", and then select "Data Analysis" from the list of options. If the Data Analysis ToolPak is not already installed, you will need to install it before you can use it.
Input the data: Input the data for the uniform distribution into a column of cells in Excel. For example, you can input the data into cells A2 through A11.
Use the Data Analysis ToolPak: In the "Data Analysis" dialog box, select the "Descriptive Statistics" option and click "OK". In the "Descriptive Statistics" dialog box, select the range of cells containing the data for the uniform distribution and select "Labels in first row" if your data includes column headers.
Calculate the variance: Once you have selected the range of cells, click "OK" to display the results of the statistical analysis. The results will include the mean, standard deviation, and variance of the uniform distribution, among other statistics.
Using the Data Analysis ToolPak is another method to calculate the variance of a uniform distribution in Excel. This method provides a more comprehensive statistical analysis of the distribution, along with other statistics such as the mean and standard deviation. However, it requires the installation of the Data Analysis ToolPak add-in before it can be used.
Using STDEV.P function
The next way to calculate the variance of a uniform distribution in Excel is to use the STDEV.P function. The STDEV.P function calculates the population standard deviation of a set of numbers and returns the result as a decimal number.
Since the variance of a uniform distribution is simply the square of the standard deviation, you can use the STDEV.P function to calculate the standard deviation and then square the result to get the variance.
Here's a step-by-step guide to calculate the variance of a uniform distribution using the STDEV.P function in Excel:
Input the data: Input the data for the uniform distribution into a column of cells in Excel. For example, you can input the data into cells A2 through A11.
Use the STDEV.P function: In a separate cell, use the STDEV.P function to calculate the standard deviation of the data. The formula for the STDEV.P function would look like this:
=STDEV.P(A2:A11)
Where A2:A11 represents the range of cells containing the data for the uniform distribution.
- Calculate the variance: Once you have entered the STDEV.P function, press the "Enter" key to display the result of the standard deviation calculation. Then, in another cell, square the result by using the formula =(standard deviation)^2.
Using the STDEV.P function is another way to calculate the variance of a uniform distribution in Excel. This method provides a quick and easy way to calculate the variance without having to manually calculate the formula for variance. However, it's important to make sure that the data inputted into the STDEV.P function accurately represents the uniform distribution you are trying to evaluate.
Conclusion
In conclusion, there are several ways to calculate the variance of a uniform distribution in Excel. The most straightforward method is to manually calculate the variance using the formula, while the Data Analysis ToolPak provides a more comprehensive statistical analysis of the distribution, including the variance. Another option is to use the STDEV.P function to quickly and easily calculate the variance by squaring the standard deviation.
No matter which method you choose, it's important to ensure that the data inputted into the calculation accurately represents the uniform distribution you are trying to evaluate. With the right tools and techniques, you can easily calculate the variance of a uniform distribution in Excel and gain valuable insights into the distribution's characteristics.
Further reading: How to Calculate a Variance Estimator? How to Calculate a Covariance?