How to Add Multiple Trendlines in Excel
Creating a chart with two trendlines has different things in common.
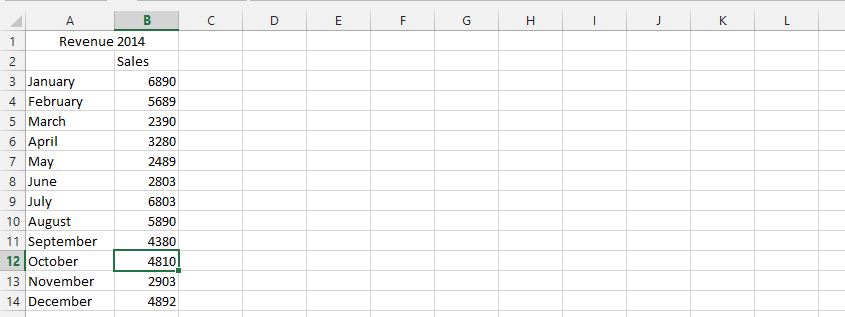
But first, you’d need to have data like this:

Inserting a chart
Mark the data, click insert, and then choose the scatter chart, and finally choose a scatter chart without marker.

Adding a trendline
Right-click on any of the series, and choose add trendline.

Decide the type of trendline you would like to see.

Scroll down, and choose if you would like to display anything like an equation or R-squared value.

Note: Repeat steps 2 through 4 to add the second trendline.
By following these steps, you will have a result that is very similar to this:

A second trendline has been added to the chart.
How to add a trendline for the same dataset
You can add as many trendlines as you like. As you can see in the picture above, I have added two trendlines: one for Mark and one for John.
Excel offers me the ability to add multiple trendlines for the same data series. I can have a lot of trend lines for Mark and a lot for John.
The process for adding a trendline to the same dataset is the same.
Click on your chart.
A plus sign will appear in the top right corner. Click on it. The Chart elements menu will open.
At the bottom of the menu is a Trendline option. It’s checked because you already have trendlines added to your chart. Click the right arrow.

Select the type of trendline you want to add. In case you want to have more options or to format the trendline right away, click More Options.
Excel will ask you for which data series you want to add another trendline. Decide and click ok.

This way you can add some trend lines to your chart.

Be careful not to add too many trend lines as the visibility of the chart will be poor.


Leave a Reply