How to Create Charts That Ignore N/A Errors and Blank Cells in Excel – Complete Guide
Excel is a powerful tool for organizing, analyzing, and visualizing data, and one of its key features is the ability to create charts and graphs that display data professionally. However, when working with data in Excel, it’s common to encounter missing values represented as N/A errors, blank cells, or other types of non-numeric data. If these missing values are included in a chart, they can produce confusing or misleading results, and make it difficult to see patterns or trends in the data.
To overcome this challenge, Excel provides several ways to ignore N/A errors and blank cells when creating charts, so that only the valid data is plotted. In this article, we’ll explain how to create charts in Excel that ignore N/A errors and blank cells, using several different techniques.
When working with real-world data, I know that data quality is often poor, with data gaps and errors that can interfere with creating charts that ignore errors effectively. This is why understanding how to create error-free charts and properly handle missing values is essential for any data professional.
If you are faced with the problem of data quality in Excel and you want to create a graph from incomplete data, then the following Excel lesson is for you. Learn how to create charts that ignore N/A errors and blank cells in Excel. Step-by-step guide to display clean, professional-looking charts.
Data preparation
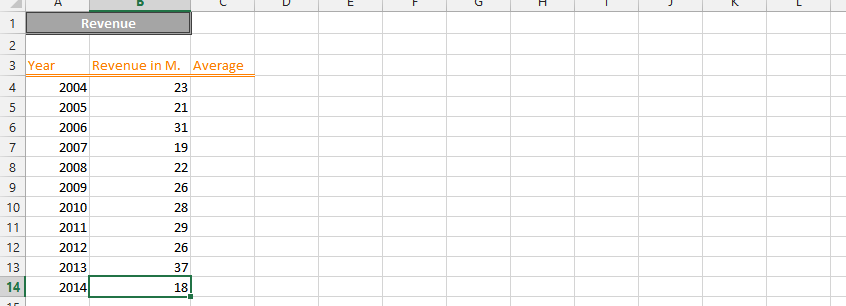
For you to create that, you need data that has the two of them, which looks like this:

Note: The result in the earning column is with the help of the IF function, as you can see in the formula bar, and the 0.6875 is the price of the product.
When building Excel charts that ignore N/A errors, first mark the relevant cells in the chart.

Inserting a line chart
To learn how to create charts that ignore N/A values and blank cells in Excel, first click Insert in the Microsoft Excel menu.

Click on the line chart.

Click on the 2-D line chart.

Right-click on the series with a break, and choose Select Data.

Click on hidden and empty cells.

Check zero, and then press ok.

The new chart ignore empty values and show empty cells as zero.

After applying these steps, the chart will be created using only the valid data in the data range, and the N/A errors and blank cells will be ignored.


Justin
Nice article, thanks for sharing.