How to Create Stock Chart in Excel
In this Excel charting tutorial, you will learn how to make a stock chart in Excel. You can use such a graph everytime you have open, high, low, close data values.
Stock data preparation
Your data should include the stock’s name, date, and the stock prices. Organize your data with the following columns: “Date”, “Open”, “High”, “Low”, and “Close”.

Note: The specific columns you need may vary based on the type of stock chart you plan to create. Common data arrangements include high, low, and closing price, or volume traded, high, low, and closing price. Another option is to include volume, open, high, low, and closing price.
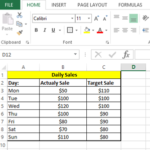
Highlight the “Open”, “High”, “Low”, and “Close” columns, then click on ‘Quick Analysis’.

Inserting a stock chart
Click charts, and then press More.

Select the type of stock chart you want to create.

Right-click on legends, and click select data.

Click edit on horizontal.

Choose stock’s names.

Press ok.

The chart will be inserted into your worksheet.

You can format the chart to your liking by adding a title, changing the axis labels, or adjusting the colors.
Here you can download free template of Stock Chart.

Leave a Reply