How to Calculate Savings in Excel
Use the Excel application to calculate how much money you will save. Here’s an example of how to set up a savings calculator in Excel.
Preparation of a savings calculator spreadsheet
Use this free calculator to do that.
1. Open Excel and make four rows, which are periodic savings, times per year, number of years, interest rate, total number of deposits, and estimated savings.

2. Enter your data in the cells corresponding to the headings: periodic savings, times per year, number of years and interest rate.

3. Calculate the total number of deposits. It is simply calculated by multiplying times per year and no. of years.

Inserting savings formula
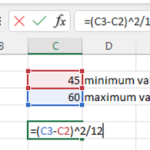
4. Now calculate estimated savings using the FV function in Excel in the cell corresponding to estimated savings. The formula goes as follows:
=FV(interest rate/times per year, total number of deposits, periodic savings)*-1

The full formula of the Saving Calculator is:
=FV(B7/B5,B9,B4)*-1
Extending the Savings Calculator
To add the ability to track multiple savings goals, you could create a new sheet for each goal and then use the FV function to calculate the estimated savings for each goal. You could then use a pivot table to summarize your savings data across all of the goals.
To add the ability to calculate the interest earned on your savings, you could use the FV function with the rate argument set to the annual interest rate. For example, the following formula would calculate the interest earned on a savings goal with a periodic savings of $100, an interest rate of 5%, and a term of 5 years:
=FV(5% / 12, 5 * 12, 100)
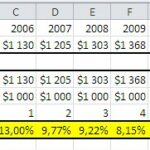
To visualize your savings progress using charts or graphs, you could use the line chart or bar chart to plot the estimated savings over time. You could also use the pie chart to show the distribution of your savings across different goals.
Here you can download this saving calculator.
Note: You can extend this example by adding additional rows for each category of expenses, or by adding a formula to calculate your savings over multiple months or years. You can also use charts or pivot tables to visualize your savings data and gain insights into your spending habits.

Leave a Reply