How to Get Values from Graph in Excel
We are going to learn how to read values from graphs. There are two ways to do this: using the Manipulate Points On Chart add-in or adding data labels to the graph.
Using the Manipulate Points On Chart add-in

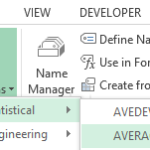
The Manipulate Points On Chart add-in allows you to get the value of any data point on a graph. First you need to download the MPOC add-in.
You need to add download and add it to Excel. Click on File, Click on Option, then click on Add-in. Select Manipulate_Points_on_Chart.
Clink the “go” button to manage Excel Add-Ins.

Check the “Excel Add-in for Manipulating Points on Charts” Add-In and click OK.
Note: The add-in is now enabled and available every time you boot Excel.

A Manipulate Points button will now appear whenever a chart object is selected under the Chart Tools -> Layout Tab of the Ribbon.
You simply have to click on the ADD-In tab and select the Manipulate Button.

Reading off a graph
Click on the chart, click on the ADD-in tab, and select Manipulate Points.

You can just select the series by clicking on the dropdown menu.

Choose a point. The value of this point will be automatically shown in the Value Textbox. (Or just click on the point within the series on your chart).

Use the Spin Button, Textbox, and Sliders to change the values of the chart.

The new value will be written on the worksheet cell that corresponds to this point on the chart. The chart will be updated to show this new value instantly.

Leave a Reply