How to Calculate Correlation in Excel
The correlation coefficient is a statistical measure that represents the strength and direction of the relationship between two variables.
In Microsoft Excel, you can calculate the correlation coefficient using the CORREL function. I will show you how to calculate the correlation coefficient in Excel and how to interpret the results.
Gather Your Data
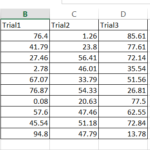
To calculate the correlation coefficient, you will need two columns of data that are related to each other. You could use the unit price and quantity of sold units to determine if there is any correlation between them.

Enter the Formula
Once you have gathered your data, you can enter the formula for the correlation coefficient in Excel.
The formula is as follows: =CORREL(range1, range2)
- range1 is the first range of data that you want to correlate.
- range2 is the second range of data that you want to correlate.
For example, if your data is in cells A1:A14 and B1:B14, you would use the following formula:
=CORREL(A1:A14,B1:B14)

Interpret the Results
The correlation coefficient, which can range from -1 to 1, reveals the nature of the relationship between the two variables:
- A correlation coefficient of 1 indicates a perfect positive correlation. This means that as one variable increases, the other variable also increases in a perfectly linear fashion.
- A correlation coefficient of -1 indicates a perfect negative correlation. In this case, as one variable increases, the other variable decreases in a perfect linear manner.
- A correlation coefficient of 0 implies no linear correlation between the variables. They are essentially unrelated.
Interpreting values between -1 and 1 can be nuanced:
- A correlation coefficient close to 1 (e.g., 0.7) suggests a strong positive correlation. As one variable increases, the other tends to increase.
- A correlation coefficient close to -1 (e.g., -0.7) indicates a strong negative correlation. As one variable increases, the other tends to decrease.
- A correlation coefficient close to 0 (e.g., 0.2 or -0.2) implies a weak correlation. The variables have a minor relationship, and changes in one do not strongly predict changes in the other.
Remember that correlation does not imply causation. Even if a strong correlation is observed, it does not necessarily mean that changes in one variable cause changes in the other.

Leave a Reply