How to Make a Progress Chart in Excel
A progress chart in Microsoft Excel is a visual representation of progress towards a goal or target. It can be used to track the progress of a project, the completion of tasks, or the attainment of a certain target. In this Excel charting tutorial you will learn how to make a progress chart. Inserting a progress chart has multiple reasons.
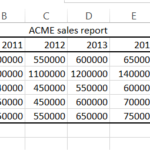
Progress data preparation
Let’s layout the data that looks something like this:

Note: The green, red and yellow signs you’d see between the values were made by following these steps: home > conditional formatting > icon set > shapes.
Inserting a progress chart
To insert progress chart in Excel do as follows:
Mark the data (1), click insert (2), then click bar chart (3), and finally click on one of the options (4).

Click add chart element (1), data labels (2), and inside end (3).

Note: The “Add Chart Element” would be visible, the moment the chart was inserted.
In the end, the chart would look like this:

Leave a Reply